by Joseph D. Sloan - O'Reilly Press
Even with the tools described in our previous segments, the real limitation with tcpdump is interpreting the data. For many uses, tcpdump may be all you need. But if you want to examine the data within packets, a packet sniffer is not enough. You need a packet analyzer. A large number of packet analyzers are available at tremendous prices. But before you start spending money, you should consider ethereal.
ethereal is available both as an X Windows program for Unix systems and as a Microsoft Windows program. It can be used as a capture tool and as an analysis tool. It uses the same capture engine and file format as tcpdump, so you can use the same filter syntax when capturing traffic, and you can use ethereal to analyze tcpdump files. Actually, ethereal supports two types of filters, capture filters based on tcpdump and display filters used to control what you are looking at. Display filters use a different syntax and are described later in this section.
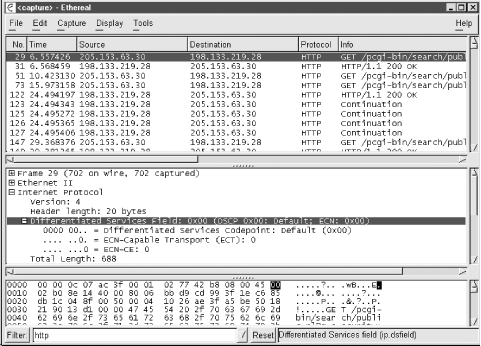
Usually ethereal will be managed entirely from a windowing environment. While it can be run with command-line options, I've never encountered a use for these. (There is also a text-based version, tethereal.) When you run ethereal, you are presented with a window with three initially empty panes. The initial screen is similar to Figure 1-1 except the panes are empty. (These figures are for the Windows implementation of ethereal, but these windows are almost identical to the Unix version.) If you have a file you want to analyze, you can select File Open. You can either load a tcpdump file created with the -w option or a file previously saved from ethereal.
Figure 1-1 ethereal
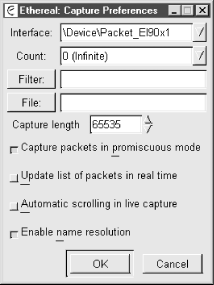
To capture data, select Capture Start. You will be presented with a Capture Preferences screen like the one shown in Figure 1-2 (below). If you have multiple interfaces, you can select which one you want to use with the first field. The Count: field is used to limit the number of packets you will collect. You can enter a capture filter, using tcpdump syntax, in the Filter: field. If you want your data automatically saved to a file, enter that in the File: field. The fifth field allows you to limit the number of bytes you collect from the packet. This can be useful if you are interested only in header information and want to keep your files small. The first of the four buttons allows you to switch between promiscuous and nonpromiscuous mode. With the latter, you'll collect only traffic sent to or from your machine rather than everything your machine sees. Select the second button if you want to see traffic as it is captured. The third button selects automatic scrolling. Finally, the last button controls name resolution. Name resolution really slows ethereal down. Don't enable name resolution if you are going to display packets in real time! Once you have everything set, click on OK to begin capturing data.
Figure 1-2 ethereal Capture Preferences
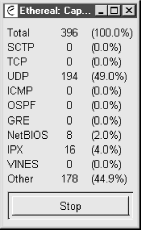
While you are capturing traffic, ethereal will display a Capture window that will give you counts for the packets captured in real time. This window is shown in Figure 1-3. If you didn't say how many frames you wanted to capture on the last screen, you can use the Stop button to end capture
Figure 1-3 ethereal Capture
Once you have finished capturing data, you'll want to go back to the main screen shown in Figure 1-1. The top pane displays a list of the captured packets. The lower panes display information for the packet selected in the top pane. The packet to be dissected is selected in the top pane by clicking on it. The second pane then displays a protocol tree for the packet, while the bottom pane displays the raw data in hex and ASCII. The layout of ethereal is shown in Figure 1-1. You'll probably want to scroll through the top pane until you find the traffic of interest. Once you have selected a packet, you can resize the windows as needed. Alternately, you can select Display Show Packet in New Window to open a separate window, allowing you to open several packets at once.
The protocol tree basically displays the structure of the packet by analyzing the data and determining the header type and decoding accordingly. Fields can be expanded or collapsed by clicking on the plus or minus next to the field, respectively. In the figure, the Internet Protocol header has been expanded and the Type-Of-Service (TOS) field in turn has been expanded to show the various values of the TOS flags. Notice that the raw data for the field selected in the second pane is shown in bold in the bottom pane. This works well for most protocols, but if you are using some unusual protocol, like other programs, ethereal will not know what to do with it.
ethereal has several other useful features. For example, you can select a TCP packet from the main pane and then select Tools Follow TCP Stream. This tool collects information from all the packets in the TCP session and displays the information. Unfortunately, while convenient at times, this feature makes it just a little too easy to capture passwords or otherwise invade users' privacy.
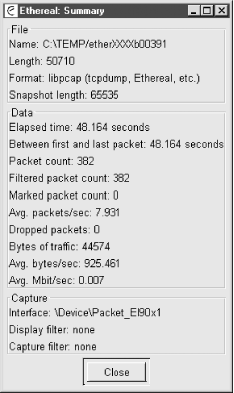
The Tools Summary gives you the details for data you are looking at. An example is shown in Figure 1-4.
Figure 1-4 ethereal Summary
There are a number of additional features that I haven't gone into here. But what I described here is more than enough for most simple tasks.